
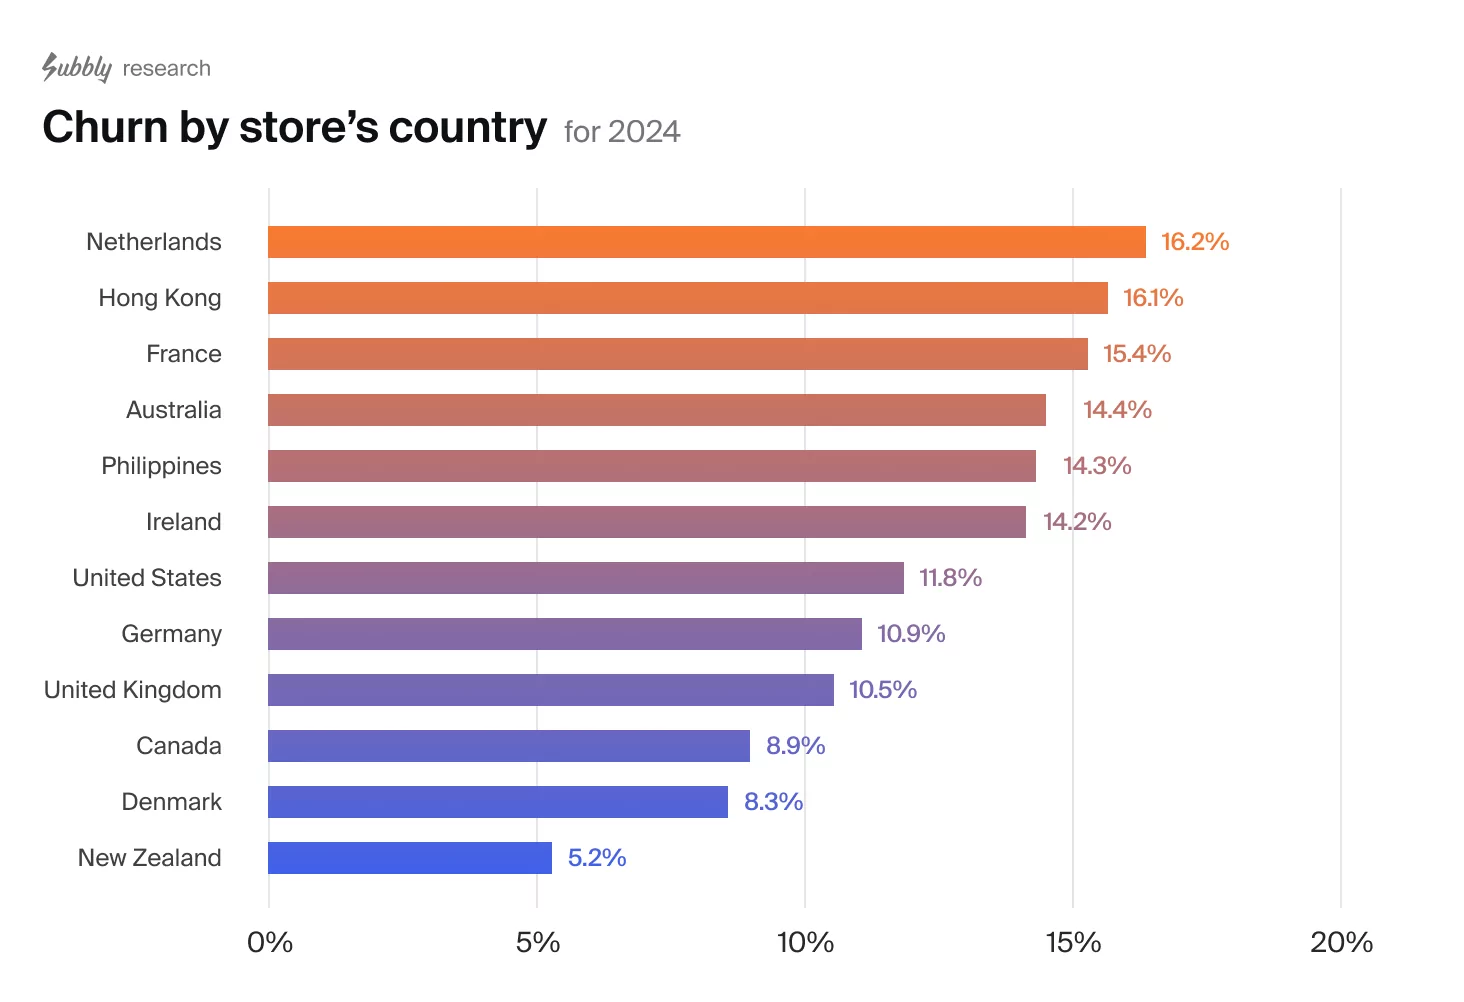
Churn by store’s country
Churn dynamics vary significantly across geographical regions due to differences in local markets, cultural factors, and customer behaviors.
These regional variations, which range from digital payment adoption to cultural attitudes about subscriptions, highlight the importance of developing location-specific retention strategies that address unique local challenges and customer preferences.
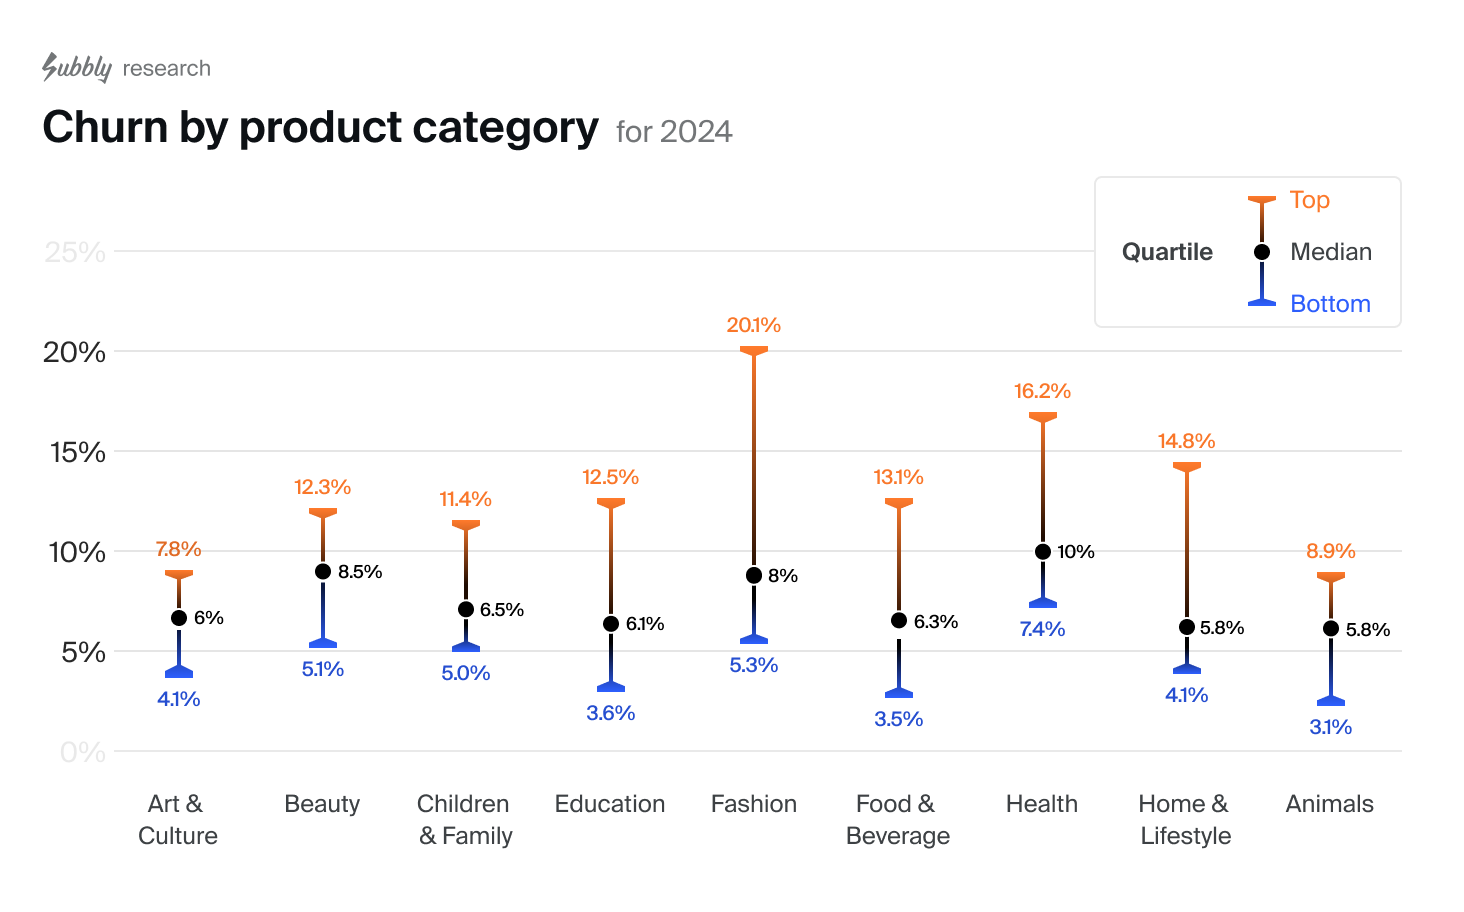
Churn by store’s product category (vertical)
Our subscription verticals reveal interesting patterns in customer retention. Arts & DIY leads with the lowest churn rate, reflecting how customers who invest time and resources in creative pursuits tend to stay longer. Pet-related subscriptions follow closely behind, driven by the strong emotional bonds between pet owners and their animals.
While surprisingly, we found fashion and health related subscriptions generally show higher churn rates.
Fashion shows a broader range of churn rates and a higher peak, indicating more volatile consumer behavior in this category. However, since the median churn rate remains normal, this pattern may simply reflect that purchasing behaviors around fashion are more complex, for instance, customers want to try the clothes on and returns are more common.
Health-related subscriptions generally show higher churn rates compared to food & beverage subscriptions, despite their related nature. This suggests consumers view health products as more optional than food. However, the relationship is complex, as health-conscious consumers often consider food and nutrition integral to their health routine.
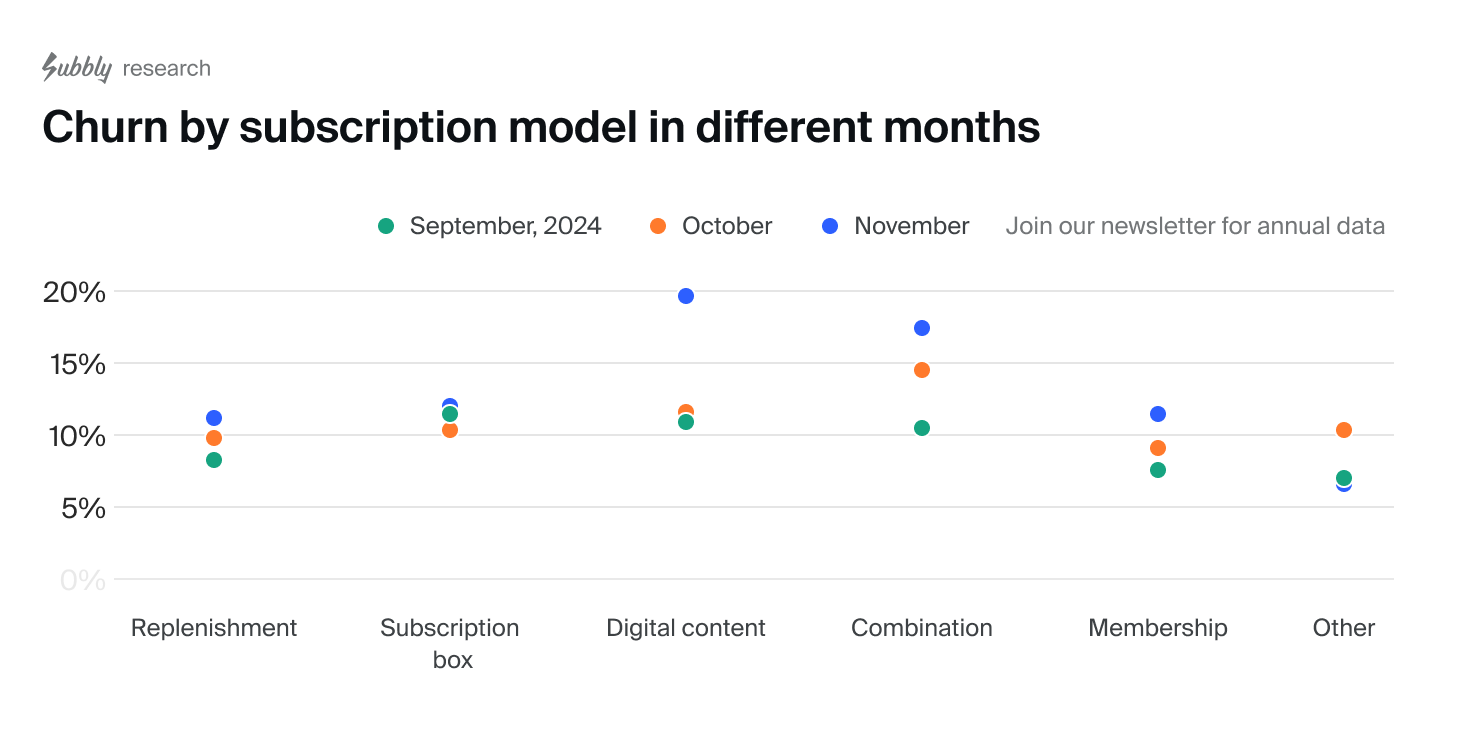
Monthly data reveals diverse churn patterns across market verticals during fall. While some sectors maintain steady retention rates, others experience significant fluctuations — especially in November, when higher churn rates suggest increased market competition and changing customer priorities.
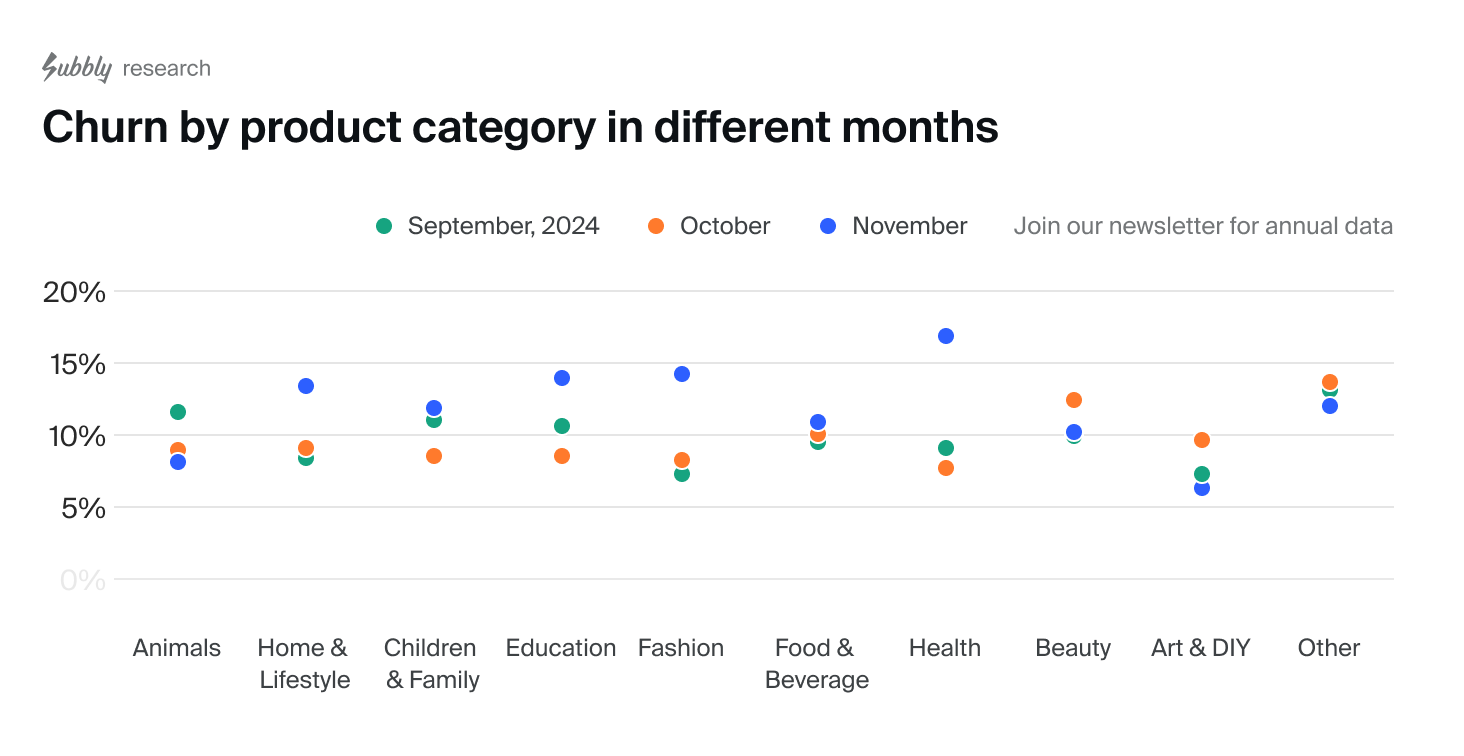
Overall, the trends highlight the need for month-specific retention strategies to address churn effectively.
We will also do an annual report covering all months, so make sure you join our Newsletter to get notified when we release new data and reports.
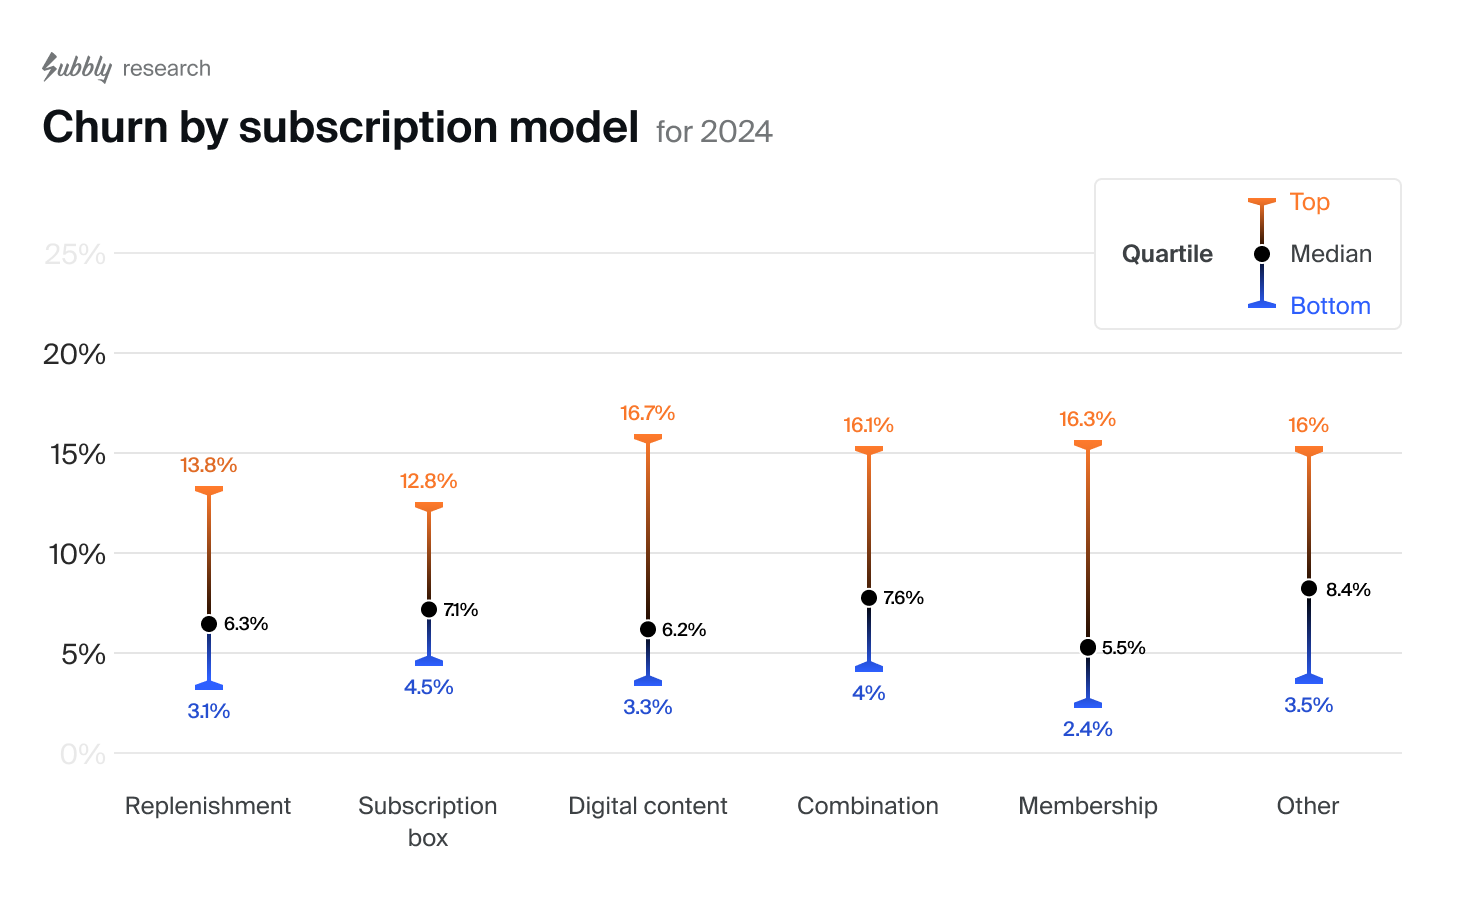
Get notifiedChurn by model
Analysis of subscription models shows that D2C replenishment services (recurring deliveries of consumable products) and curated subscription boxes consistently outperform other business models in customer retention.
This success stems from their ability to deliver clear, tangible value—replenishment services save customers time and prevent stockouts, while subscription boxes offer an engaging “discovery” experience that keeps customers excited about their next delivery.
D2C/replenishment models demonstrate lower churn rates in both the bottom quartile (3.1%) and median (6.31%) compared to curation models (7.1% and 4.5% respectively), though their top quartile is slightly higher (13.8% vs 12.8%).
This trend suggests that consumable products foster stronger customer loyalty, while curated boxes tend to be viewed as discretionary purchases. Interestingly, the retention difference between these models proved smaller than expected.
Digital content models show the highest top quartile churn rate at 16.7%, indicating lower customer engagement and perceived value.
Analysis of data from September to November 2024 shows consistent patterns across most subscription models. Access subscriptions are the only exception, showing notable fluctuations in November.
The data also reveals an interesting seasonal trend—churn rates are significantly lower in September, likely due to increased subscriber stability during the back-to-school period.
These seasonal shifts reflect changing consumer habits and priorities throughout the year, reinforcing the importance of tailoring retention strategies to specific months.
Make sure you don’t miss out on the annual report covering all months—subscribe to our Newsletter to receive notifications about new data and reports.
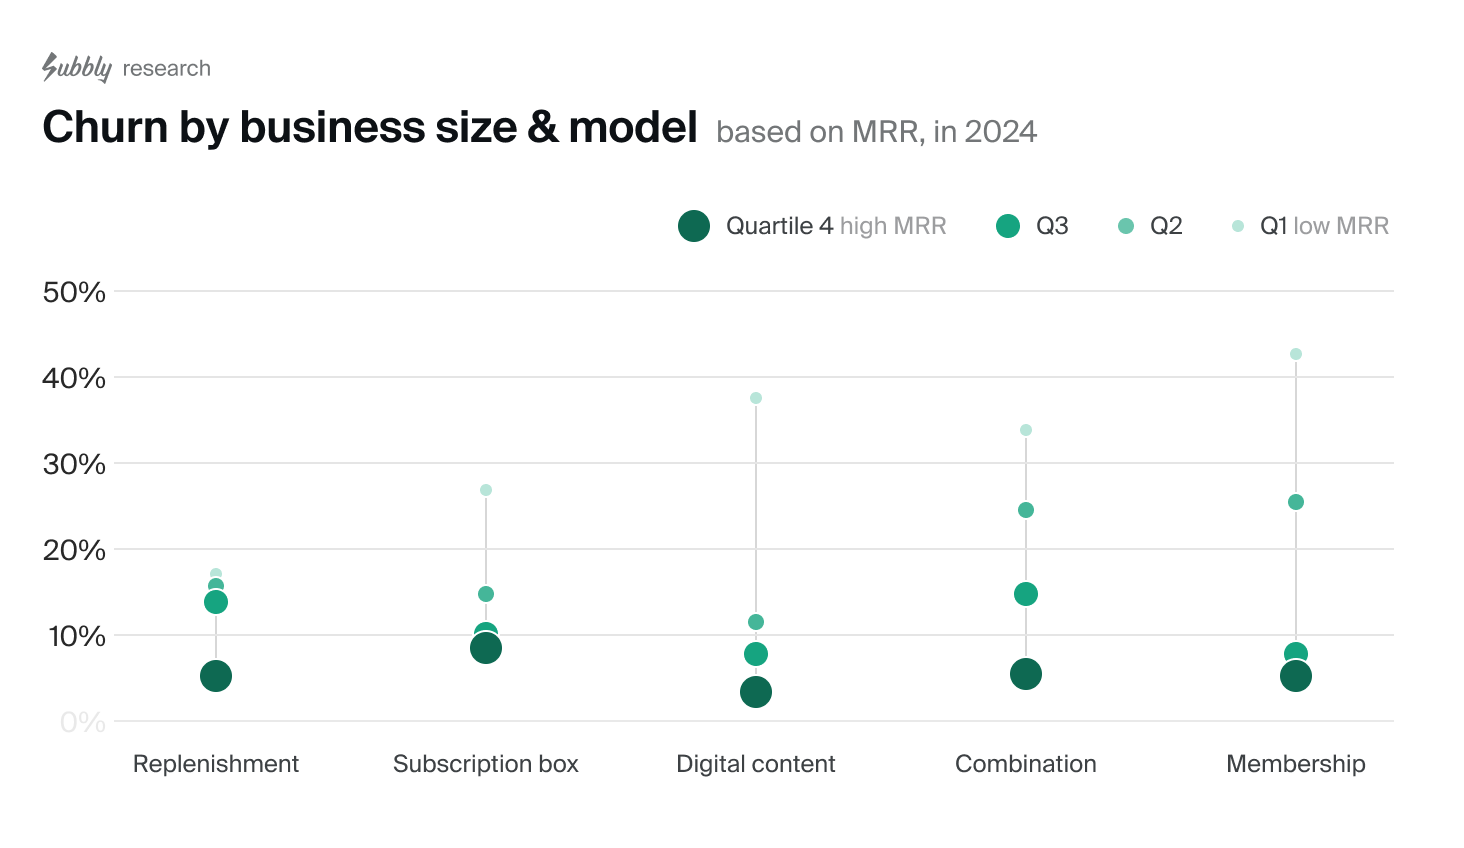
Churn by merchant’s size with different subscription models
Larger businesses tend to have significantly lower churn. Among them, memberships boast the lowest churn rates, whereas subscription boxes demonstrate the highest churn among larger businesses.
The churn paradox
Conventional wisdom suggests that higher-priced subscriptions would face greater customer churn, as people are typically more cautious about maintaining expensive commitments.
However, our data reveals a fascinating insight: there is absolutely no correlation between Average Order Value (AOV) and churn rates! This means that customers are just as likely to maintain their subscription whether they’re paying $10 or $100 per month.
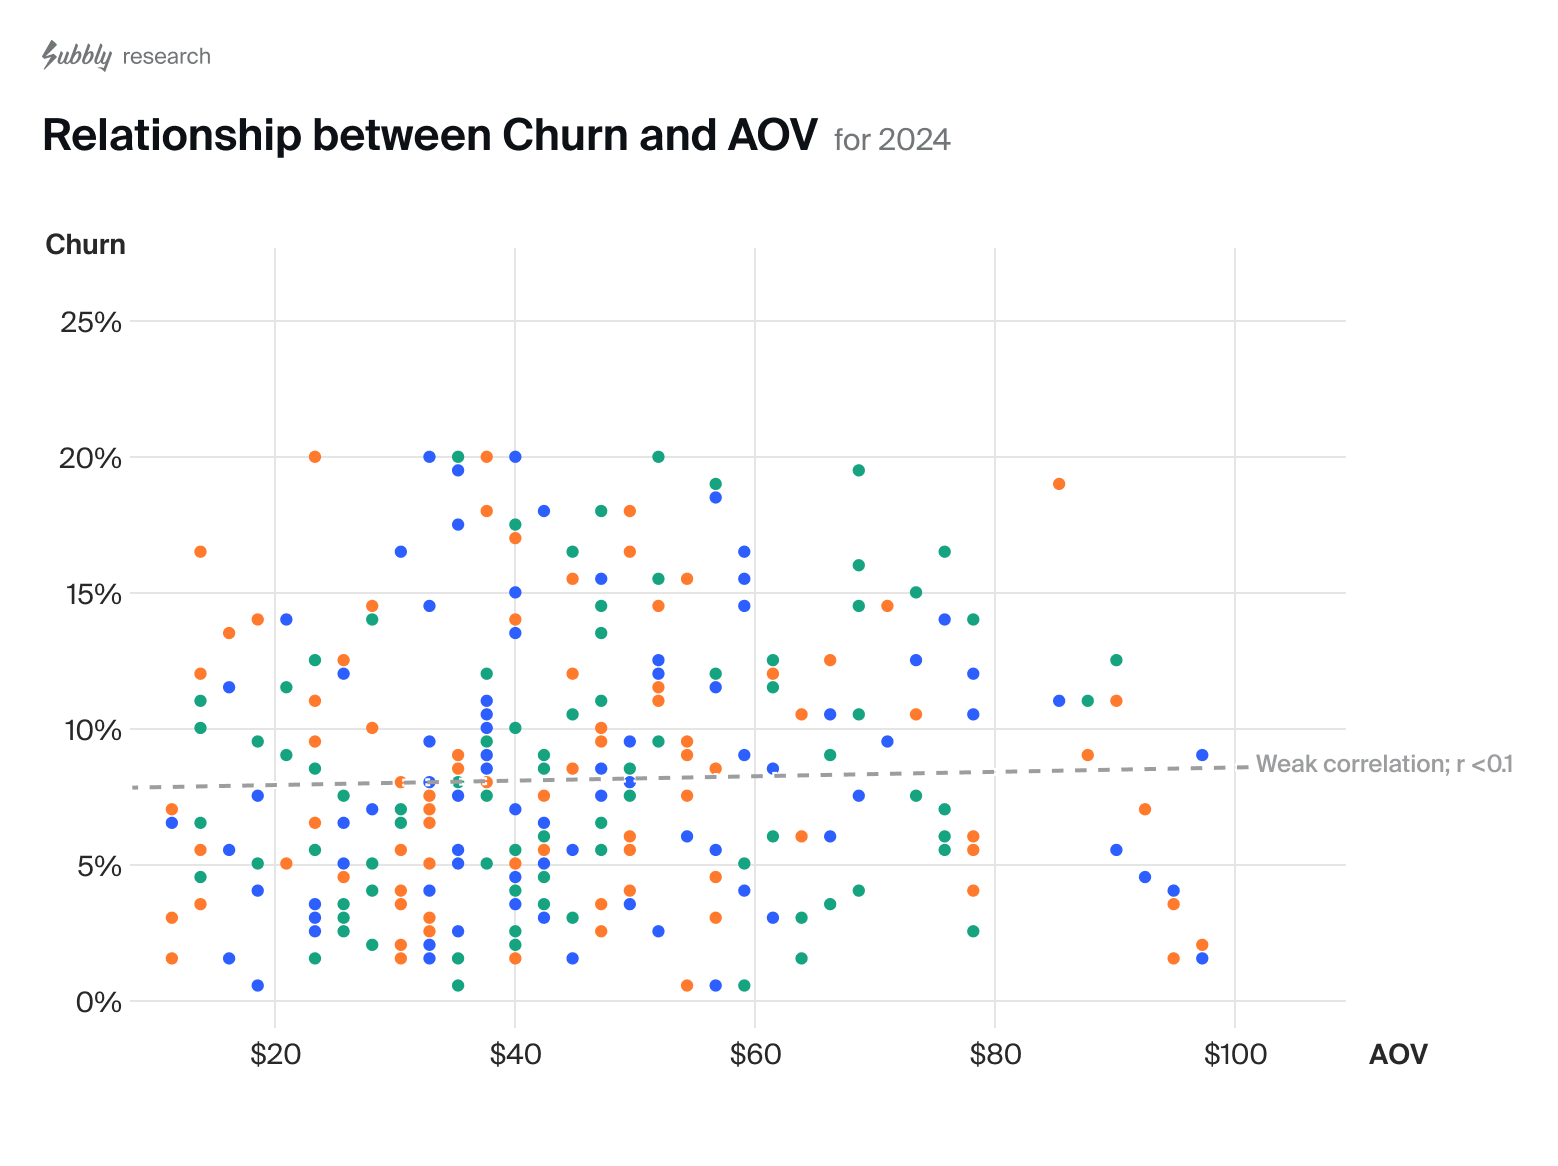
This discovery challenges a fundamental assumption in subscription business modeling. It shows that factors like market positioning, accurate targeting, product value, customer experience, and service quality are far more important for retention than price point alone.
For subscription-first businesses, this means pricing strategies can be more flexible than previously thought—with the focus shifting to value delivery rather than price sensitivity.

While price points may affect pre-subscription conversion rates (depending on your positioning, vertical, and ideal customer profile), this requires further investigation from the Subbly research team. As always, we recommend testing these factors to determine their specific impact on your business, ICP, and vertical.
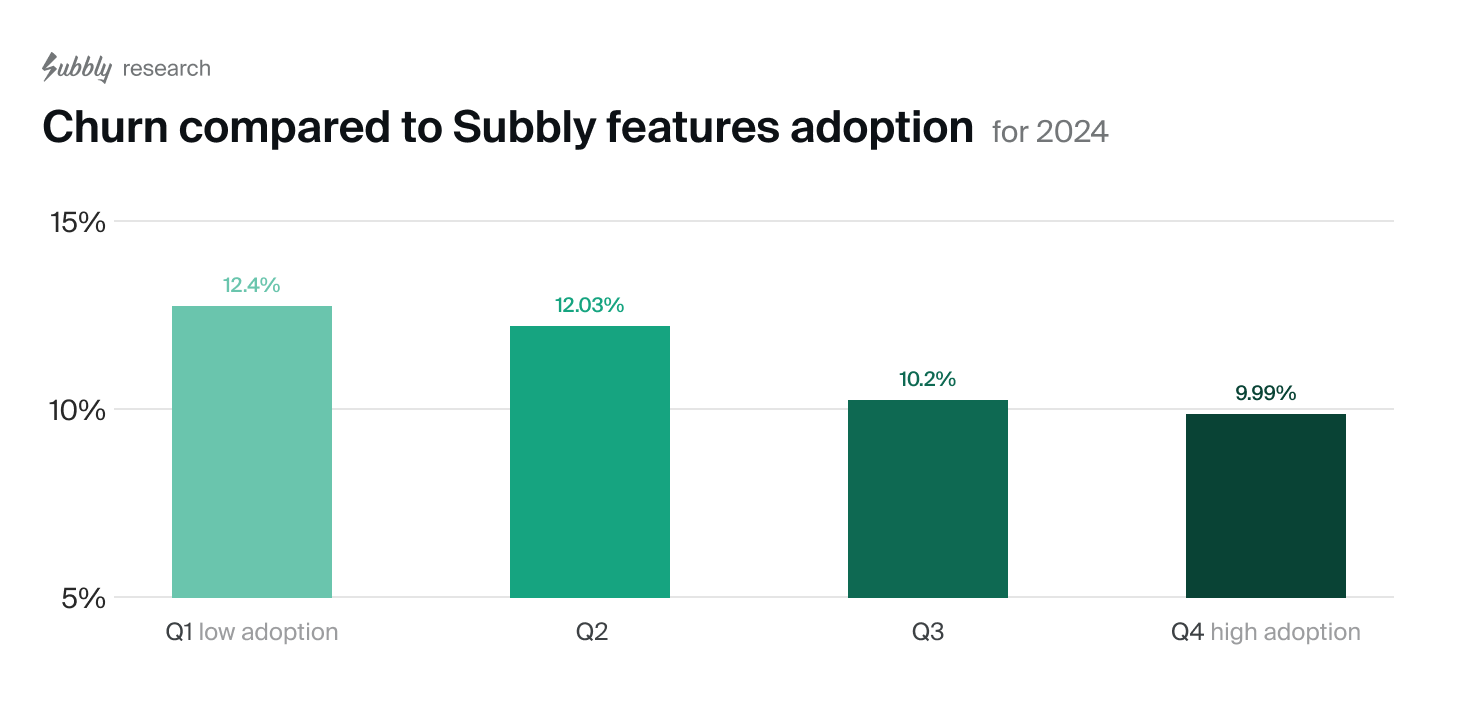
Bonus insight 1: Churn by feature adoption
Our data reveals a strong correlation between platform feature usage and customer retention. Merchants who leverage more of Subbly’s features experience better customer retention rates (9.34% average churn for the lowest adoption quartile compared to 11.89% for the highest).
Notably, businesses in the top quartile—using 56% or more of available features—demonstrate the strongest retention rates. This suggests that deeper platform integration not only streamlines operations but also creates a more engaging and valuable subscriber experience. Contact our team to learn more about our churn mitigation features.
Churn reducing features on Subbly include: AI churn predictions which can be paired with automations, cancellation mitigation offers, churn insights, chat-to-cancel, and more.
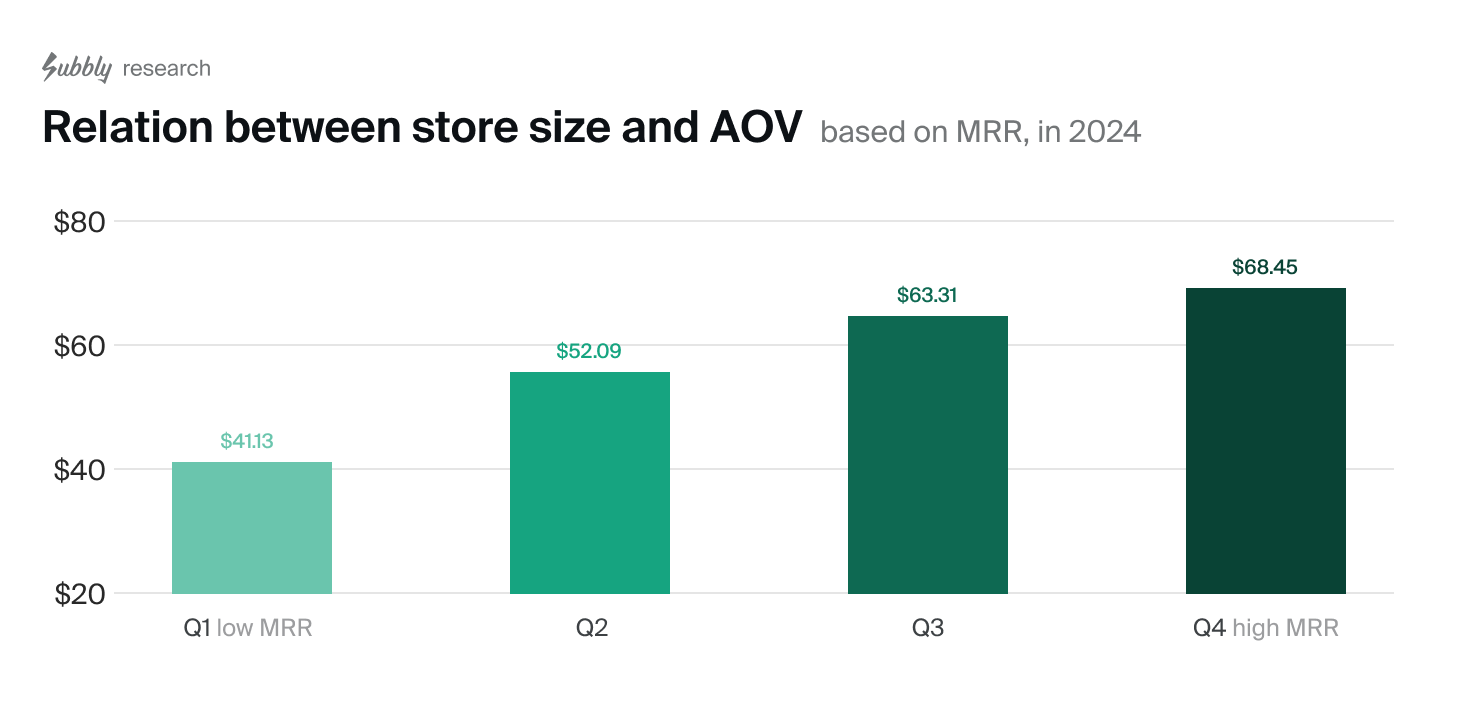
Bonus insight 2: AOV and MRR
A higher Average Order Value (AOV) acts as a powerful multiplier for Monthly Recurring Revenue (MRR). Smaller businesses (lowest quartile by MRR) had an average AOV of $43.36, while the highest quartile reached $69.93—representing a ~60% increase in AOV from the smallest to the largest businesses.
While adding new subscribers grows your business linearly, increasing AOV amplifies revenue across your entire customer base. Smart businesses leverage both growth levers—expanding their subscriber base while strategically enhancing their offerings’ value (and thus price point). This dual approach creates a compound effect that accelerates revenue growth.
Key takeaways
Our comprehensive analysis reveals several crucial insights for subscription businesses:
- Price point (AOV) has no impact on churn
- Different verticals show distinct churn patterns, with Arts & DIY and Pet-related subscriptions showing strongest retention
- Replenishment services and curated boxes demonstrate superior retention rates
- Larger merchants generally experience lower churn rates and higher AOV—meaning to grow substantially you need to optimize your offering towards both metrics.
- Geographic and cultural factors significantly impact churn rates, necessitating localized retention strategies
- Higher platform (Subbly) feature adoption correlates strongly with better retention
These insights suggest that success in the subscription economy requires a multi-faceted approach: understanding your market, choosing the right business model, maximizing platform capabilities, and focusing on delivering value rather than competing on price alone. By implementing these learnings, subscription businesses can build more resilient, growth-oriented operations.
Stay tuned for our upcoming annual report covering all months — subscribe to our Newsletter for notifications about new data and reports.
Get notified